Monitoring Model Performance: A Faceoff between Amazon SageMaker and Databricks ML
Model monitoring is crucial in the lifecycle of machine learning models, especially for models deployed in production environments. Model monitoring is not just a "nice-to-have" but is essential to ensure the models' robustness, accuracy, fairness, and reliability in real-world applications. Without monitoring, model predictions can be unreliable, or even detrimental to the business or end-users. As a model builder, how often have you thought about how models’ behavior will change over time? In my professional life, I have seen many production systems managing model retraining life cycle using heuristic, gut feel or scheduled basis, either leading to the wastage of precious resources or performing retraining too late.
This is a ripe problem space as many models have been deployed in production. Hence there are many point solutions such as Great Expectations, Neptune.ai, Fiddler.ai who all boast really cool features either in terms of automatic metrics computation, differentiated statistical methods or Responsible AI hype that has become a real need of time (Thanks to ChatGPT and LLMs). In this Op-ed, I would like to touch upon two systems that I am familiar with and are widely used.
Amazon SageMaker Model Monitor
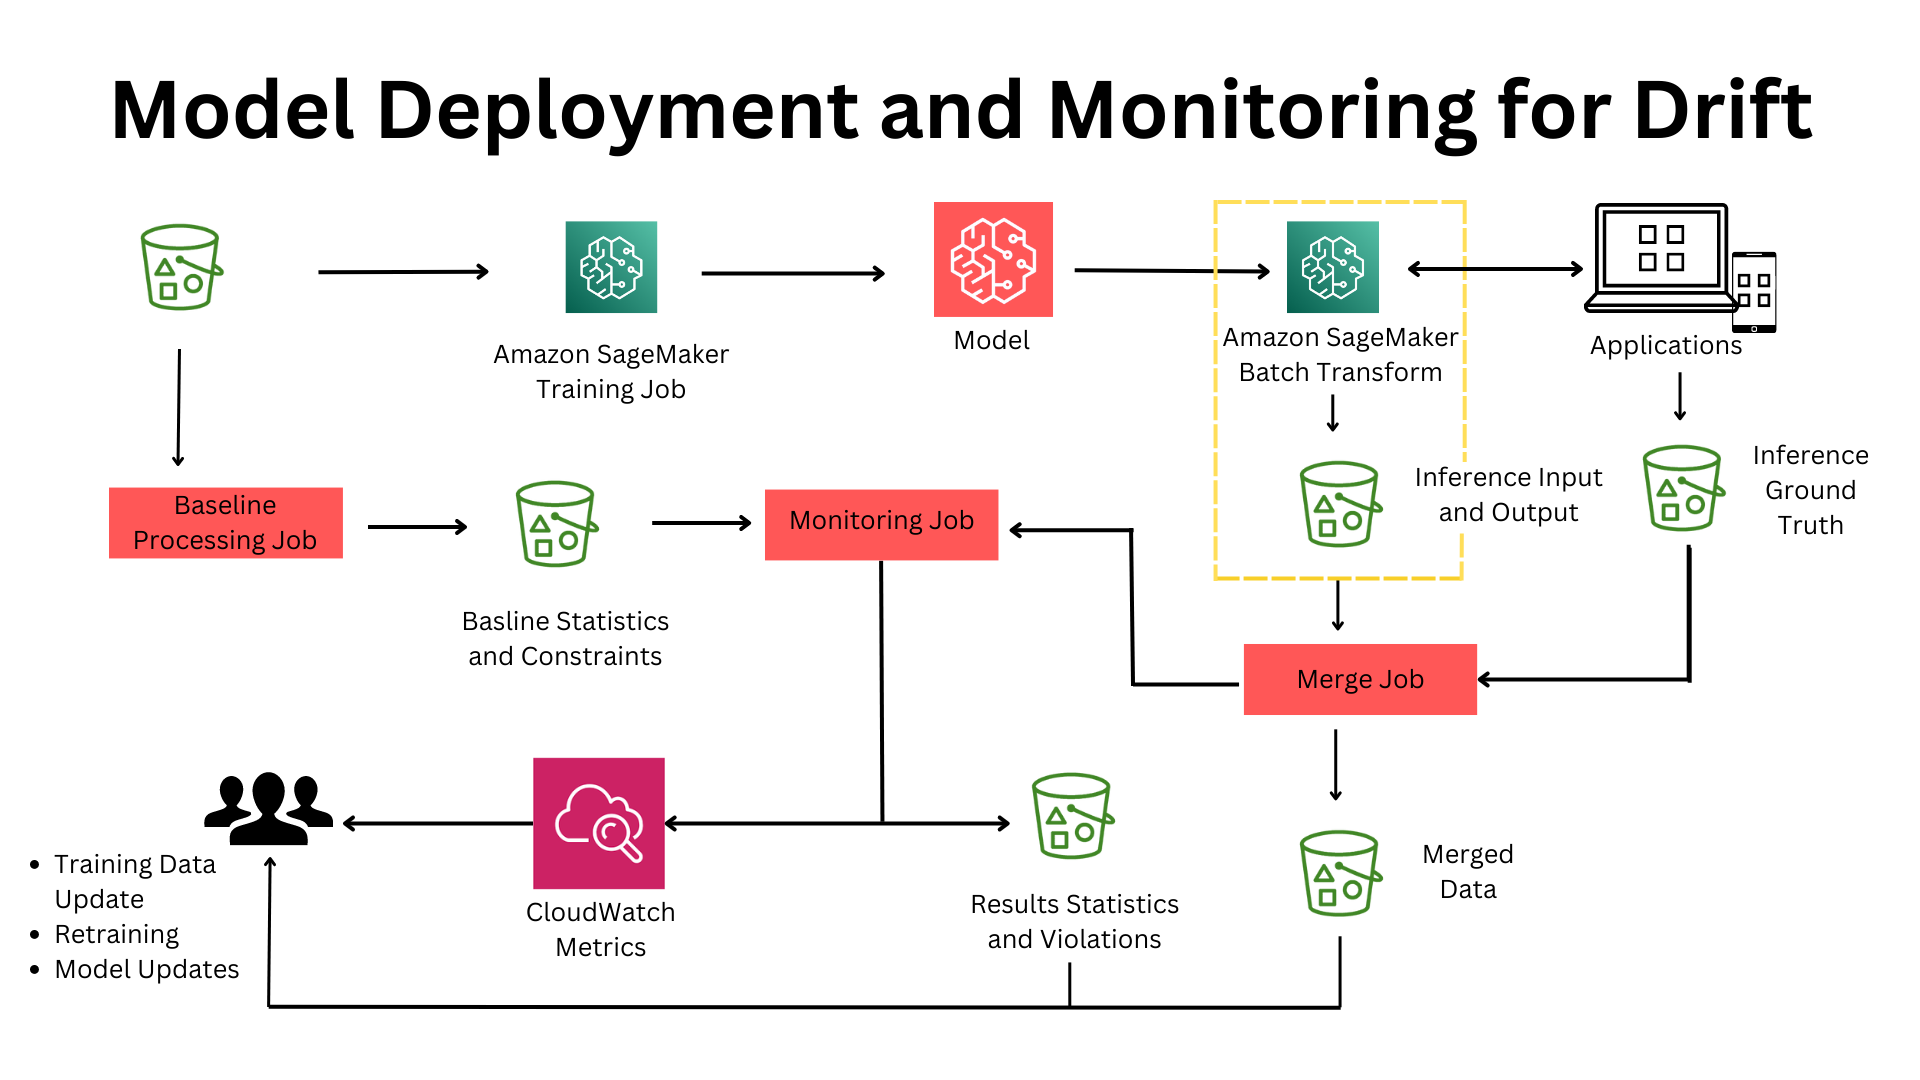
Amazon SageMaker is AWS’s flagship fully managed ML service to Build, Train, Deploy & “Monitor” Machine Learning models. The service provides click through experience for set up using SageMaker Studio or API experience using SageMaker SDK. SageMaker assumes you to have clean datasets for training and can capture inference request/response based on user defined time interval. The system works for model monitoring if models are the problem, BUT What if Data that is fed to the model is a problem or a pipeline well upstream in ETL pipeline is a problem. AWS provides multiple Data Lake architectures and patterns to stitch end-2-end data and AI systems together but tracking data lineage is easy if not impossible.
The monitoring solution is flexible thanks to SageMaker processing job which is underlying mechanism to execute underlying metrics. SageMaker processing also lets you build your custom container. SageMaker model monitoring is integrated with Amazon SageMaker Clarify and can provide Bias Drift which is important for Responsible AI. Overall SageMaker monitoring does a decent job of alerting when model drifts.
Databricks Lakehouse Monitoring
Let's look at the second contender. Databricks is a fully managed Data and AI platform available across all major clouds and also boasts millions of downloads of MLFlow OSS. I have recently come across Databricks Lakehouse Monitoring which IMO is a really cool paradigm of Monitoring your Data assets.
Let me explain why you should care if you are an ML Engineer or Data Scientist?
Let's say you have built a cool customer segmentation model and deployed it in production. You have started monitoring the model using one of the cool bespoke tools I mentioned earlier which may pop up an alert blaming a Data field. Now What?
✔ How do you track where that field came from cobweb of data ETL pipeline?
✔ How do you find the root cause of the drift?
✔ How do you track where that field came from cobweb of data ETL pipeline?
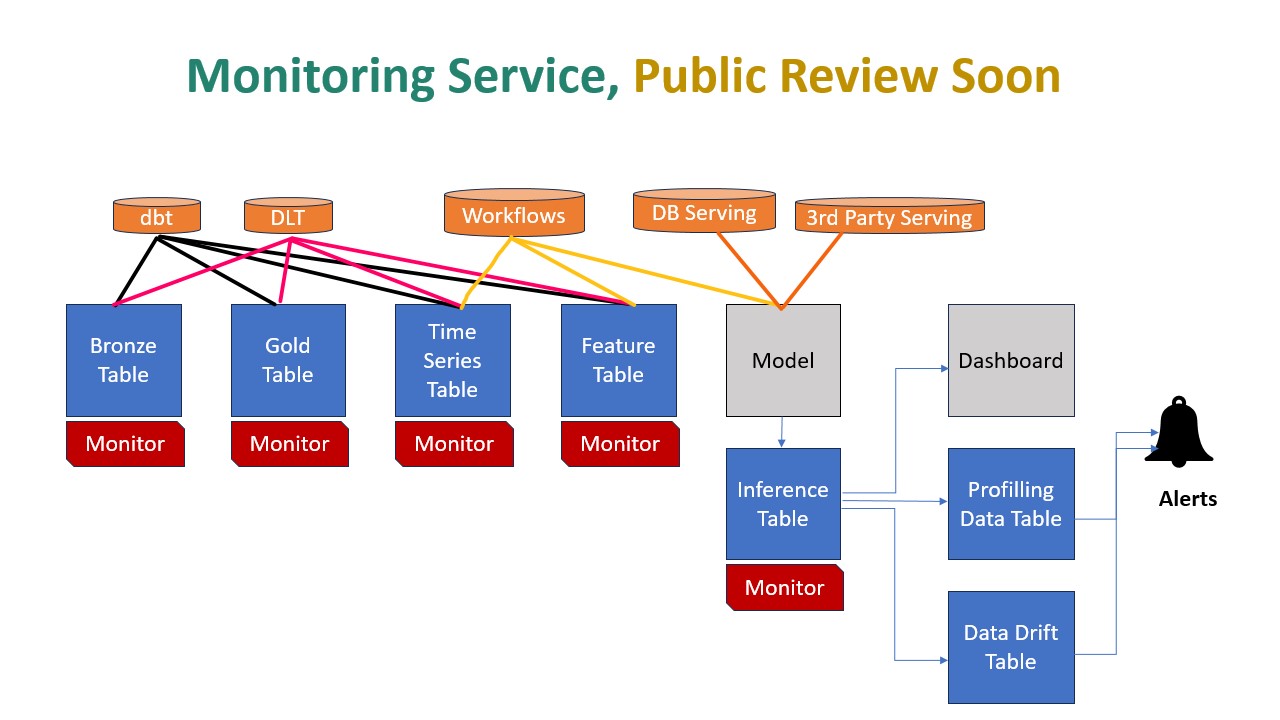
Here comes Databricks Lakehouse Monitoring to the rescue. Databricks Lakehouse Monitoring lets you monitor all of the tables in your account. You can also use it to track the performance of machine learning models and model-serving endpoints by monitoring inference tables created by the model’s output.
Let's put this in perspective, Data Layer is a foundation of AI. When teams across data and AI portfolios work together in a single platform, productivity of ML Teams, Access to Data assets and Governance is much superior compared to siloed or point solution.
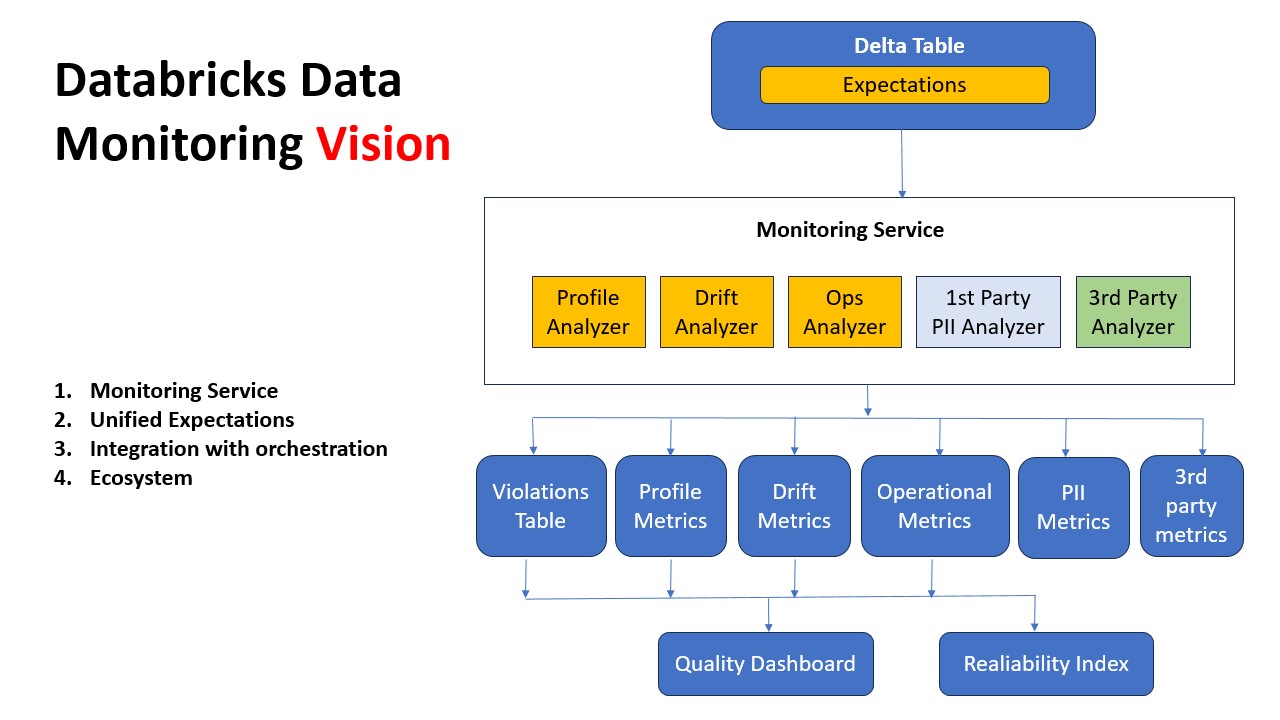
The Vision below essentially captures an ideal Data and Model Monitoring solution. The journey starts with raw data with Bronze -> Silver -> Golden layers. Moreover, Features are also treated as another table (That’s refreshing and new paradigm, Goodbye feature stores). Now you get down to ML brass tacks by using Golden/Feature Tables for Model training and serve that model up.
Databricks recently launched in preview awesome Inference table feature. Imagine all your requests/responses captured as a table than raw files in your object store. Possibilities are limitless if the Table can scale. Once you have ground truth after the fact, just start logging it in Groundtruth Table. Since all this data is being ETLed using Databricks components, the Unity catalog offers nice end-2-end data lineage similar to Delta Live Tables.
Now you can turn on Monitors, and Databricks start computing metrics. Any Data Drift or Model Drift can be root caused to upstream ETL tables or source code. Imagine that you love other tools in the market for monitoring, then just have them crawl these tables and get your own insights.
Looks like Databricks want to take it up the notch by extending Expectations framework in DLT to extend to any Delta Table. Imagine the ability to set up column level constraints and instructing jobs to fail, rollback or default. So, it means problems can be pre-empted before they happen. Can't wait to see this evolution in the next few months.
To summarize, I came up with the following comparison between SageMaker and Databricks Model Monitoring.
| Capability | Winner | SageMaker | Databricks |
|---|---|---|---|
| Root cause Analysis | Databricks | Constraint and violations due to concept and model drift | Extends RCA to upstream ETL pipelines as lineage is maintained |
| Built-in statistics | SageMaker | Uses Deque Spark library and SageMaker Clarify for Bias drift | Underlying metrics library is not exposed but most likely Spark library |
| Dashboarding | Databricks | Available using SageMaker Studio so it is a must | Redash dashboards are built and can be customized or use your favorite BI tool. |
| Alerting | Databricks | Needs additional configuration using Event Bridge | Built in alerting |
| Customizability | Both | Uses Processing jobs so customization of your own metrics | Most metrics are built-in, but dashboards can be customized |
| Use case coverage | SageMaker | Coverage for Tabular and NLP use cases | Coverage for tabular use cases |
| Ease of Use | Databricks | One-click enablement | One-click enablement but bonus for monitoring upstream ETL tables |
Hope you enjoyed the quick read. Hope you can engage Propensity Labs for your next Machine Learning project no matter how hard the problem is, we have a solution. Keep monitoring.
Comments
Post a Comment